April 20, 2017
Below is my first exploratory analysis Kernel that I submitted on Kaggle.
First Kernel
Hello! I plan to look at solved murders. Eventually, I plan to make a prediction on the relationship of the perpetrator to the victim; however, this kernel I will explore perpetrator sex to the victim, the weapon used on the victim
import numpy as np
import pandas as pd
import seaborn as sns
import matplotlib.pyplot as plt
pd.set_option('display.max_columns', None)
%matplotlib inline
df = pd.read_csv('murders.csv', low_memory=False)
df.columns = df.columns.map(lambda x: x.replace(' ', '_'))
df.dtypes.tail(8)
Perpetrator_Age          object
Perpetrator_Race         object
Perpetrator_Ethnicity    object
Relationship             object
Weapon                   object
Victim_Count              int64
Perpetrator_Count         int64
Record_Source            object
dtype: object
Perpetrator_Race did not transform properly when put in a Data Frame. Upon investigation, their was a string in one of the values
``````
df = df[df.Perpetrator_Age.str.contains(' ') == False]
df['Perpetrator_Age'] = pd.to_numeric(df['Perpetrator_Age'], errors='coerce')
df = df[df['Crime_Solved'] == "Yes"]
df = df[df['Relationship'] != 'Unknown']
df = df[df['Crime_Type'] == 'Murder or Manslaughter']
df = df[df['Victim_Sex'] != 'Unknown']
If I want to determine who killed the victim, I need to take out large scale murders, where the perpetrators did not necessarily know their victim beforehand. I also want to focus on a individual perpetrator basis, because I feel that when multiple perpetrators murder, motives and relationships may significantly differ.
ALSO, there seems to be a major error in Perpetrator_Age, when Age is 0 and 1. It seems, that in some cases, when the age was unknown, the input was 0 or 1; So I will take out these cases.
df = df[df['Victim_Sex'] != 'Unknown']
df = df[df['Perpetrator_Age'] >= 2]
df = df[df['Victim_Count'] < 1]
df = df[df['Perpetrator_Count'] == 0]
##Take out mass killings, such as OKC Bombing of 1995
df = df.sort_values('Victim_Count').drop_duplicates(subset=['Agency_Code',
                                                        'Agency_Name', 'Agency_Type',
                                                        'City', 'State', 'Year', 'Month',
                                                        'Perpetrator_Race', 'Perpetrator_Age',
                                                        'Relationship'], keep='last')
plt.figure(figsize=(12,15),facecolor='#efefef')
sns.set()
# ax.set_ticklabels(['0%', '20%', '75%', '100%'])
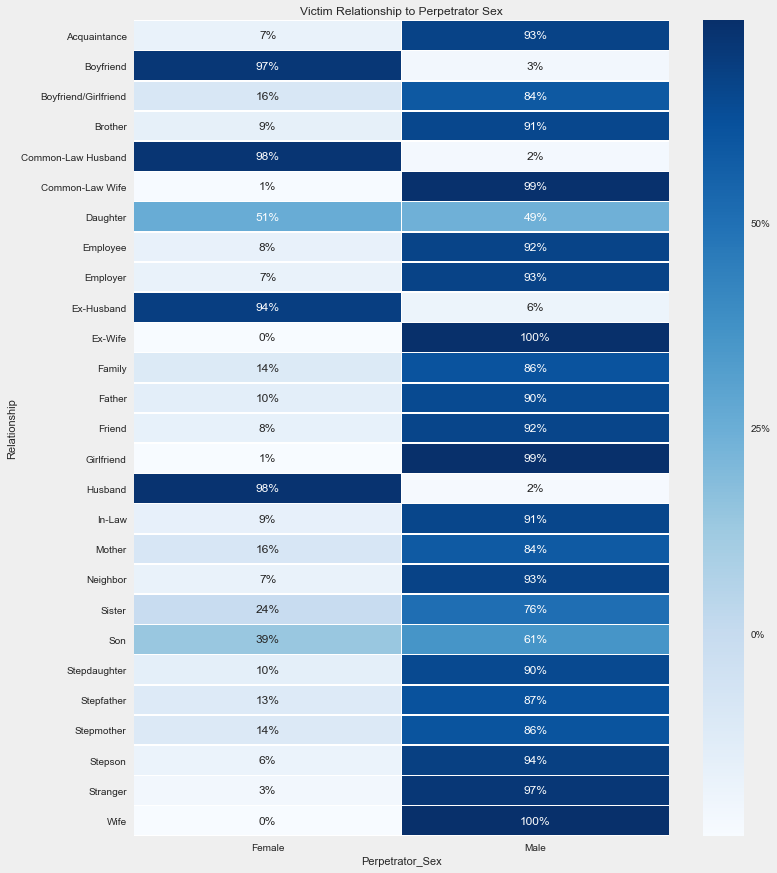
ax = sns.heatmap(pd.crosstab(df.Relationship,df.Perpetrator_Sex).apply(lambda r: r/r.sum(), axis=1), annot=True, fmt=".0%", linewidths=.5,cmap='Blues')
ax.set_title('Victim Relationship to Perpetrator Sex')
cbar = ax.collections[0].colorbar
cbar.set_ticks([0, .25, .50, .75, 1])
cbar.set_ticklabels(['0%', '25%', '50%', '75%', '100%'])
plt.figure(figsize=(12,12),facecolor='#efefef')
sns.set()
# ax.set_ticklabels(['0%', '20%', '75%', '100%'])
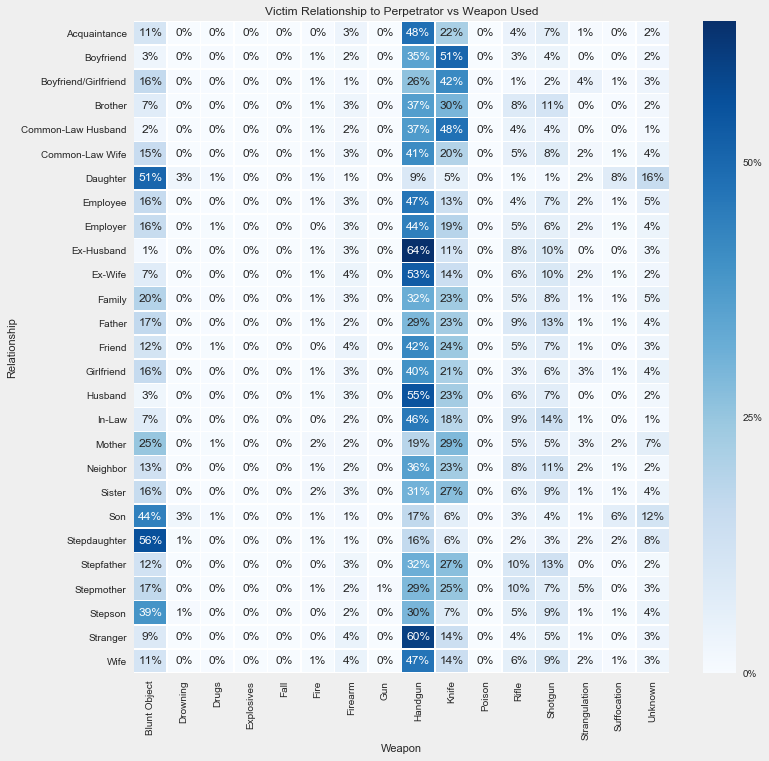
ax = sns.heatmap(pd.crosstab(df.Relationship,df.Weapon).apply(lambda r: r/r.sum(), axis=1), annot=True, fmt=".0%", linewidths=.5,cmap='Blues')
ax.set_title('Victim Relationship to Perpetrator vs Weapon Used')
cbar = ax.collections[0].colorbar
cbar.set_ticks([0, .25, .50, .75, 1])
cbar.set_ticklabels(['0%', '25%', '50%', '75%', '100%'])
plt.figure(figsize=(12,12),facecolor='#efefef')
sns.set()
# ax.set_ticklabels(['0%', '20%', '75%', '100%'])
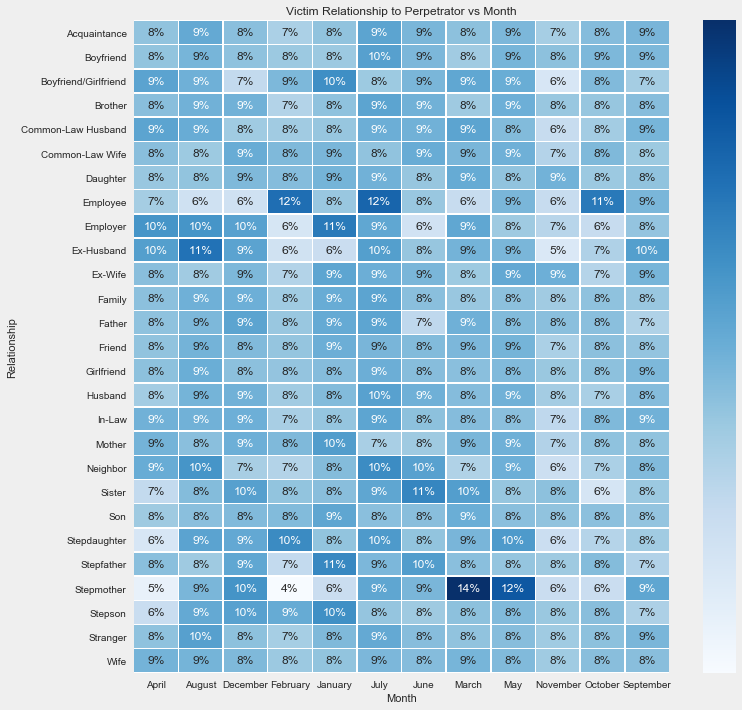
ax = sns.heatmap(pd.crosstab(df.Relationship,df.Month).apply(lambda r: r/r.sum(), axis=1), annot=True, fmt=".0%", linewidths=.5,cmap='Blues')
ax.set_title('Victim Relationship to Perpetrator vs Month')
cbar = ax.collections[0].colorbar
cbar.set_ticks([0, .25, .50, .75, 1])
cbar.set_ticklabels(['0%', '25%', '50%', '75%', '100%'])
What about What weapon did Males vs Female use?
plt.figure(figsize=(12,12),facecolor='#efefef')
sns.set()
# ax.set_ticklabels(['0%', '20%', '75%', '100%'])
ax = sns.heatmap(pd.crosstab(df.Victim_Sex,df.Weapon).apply(lambda r: r/r.sum(), axis=1), annot=True, fmt=".0%", linewidths=.5,cmap='Blues')
ax.set_title('Perpetrator Gender vs Weapon Use')
cbar = ax.collections[0].colorbar
cbar.set_ticks([0, .25, .50, .75, 1])
cbar.set_ticklabels(['0%', '25%', '50%',  '75%', '100%'])
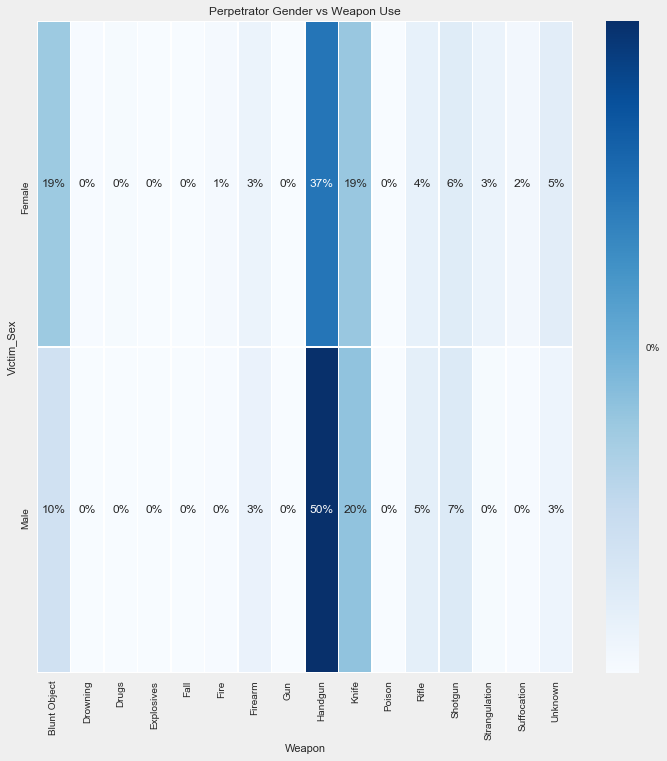
It seems as Handguns, Knife, and Blunt Objects were the most used for both genders
plt.figure(figsize=(12,12),facecolor='#efefef')
sns.set()
# ax.set_ticklabels(['0%', '20%', '75%', '100%'])
ax = sns.heatmap(pd.crosstab(df.Weapon,df.Perpetrator_Sex).apply(lambda r: r/r.sum(), axis=1), annot=True, fmt=".0%", linewidths=.5,cmap='Blues')
ax.set_title('Weapon Use vs Gender')
cbar = ax.collections[0].colorbar
cbar.set_ticks([0, .25, .50, .75, 1])
cbar.set_ticklabels(['0%', '25%', '50%',  '75%', '100%'])
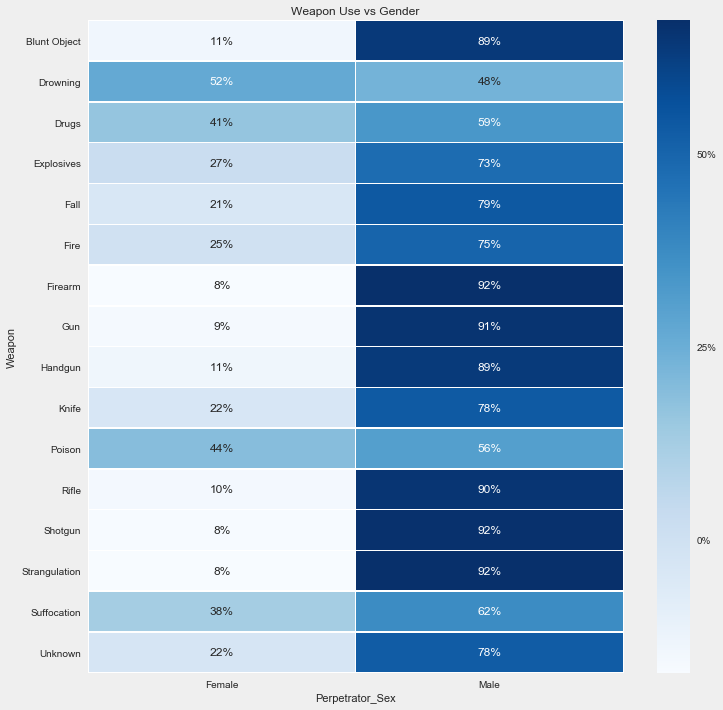
However, the ratio of each method used compared to the other gender shows that Female perpetrators used Drowning as a means of killing the most frequently. Second was Poison, and third was suffocation.