April 21, 2017
Playoffs in the NBA just started, and I hear reporters on the news talking about chemistry all the time. However, what exactly is chemistry? What determines if teammates have good chemistry?
I decide to google “NBA Chemistry”, and the consensus online is “chemistry”, is actually really hard to define, because it is not quantified yet. So, how do you measure chemistry, when it could mean a million different variables? I decided to take a stab at it by using machine learning methods.
My first step was to find and scrape data that relied on player to player interaction. I couldn’t just scrape any stats data, I had to find data that showed how well two different teammates played together while on the floor at the same time. I used Beautiful Soup and Selenium to scrape and piece the data together into a Pandas Dataframe.
Setup
import requests
import feather
import pandas as pd
import os
import string
from bs4 import BeautifulSoup
from selenium import webdriver
from selenium.webdriver.support import expected_conditions as EC
from selenium.webdriver.common.by import By
from selenium.webdriver.support.ui import WebDriverWait
from selenium.webdriver.common.keys import Keys


chromedriver = "/usr/local/bin/chromedriver"
driver = webdriver.Chrome(chromedriver)
Setup Part 2
This Code takes a list of all basketball players and puts them in a list that will be iterated through
alphabet_test = list(string.ascii_lowercase)
def site_list():
    alphabet_list_list = []
    for xyz in alphabet_test:
        alphabet_list_list.append('http://www.basketball-reference.com/players/' + xyz)
    return alphabet_list_list

def feather_list():
    feather_list = []
    for abc in alphabet_test:
        feather_list.append(abc)
    return feather_list
Setup Part 3
In order to scrape properly and for basketball-reference to not detect scraping, this code waits until page is fully laoded. These are the functions to get from the all player page to the player to player table.
# Setup Function
def selector_tools():
    selector1 = WebDriverWait(driver, 20).until(
            EC.element_to_be_clickable((By.XPATH, '//*[@id="all_lineups-2-man"]/div[1]/div'))
            );
    selector1.click()

    selector2 = WebDriverWait(driver, 20).until(
            EC.element_to_be_clickable((By.XPATH, '//*[@id="share_on_lineups-2-man"]'))
            );
    selector2.click()

    selector3 = WebDriverWait(driver, 20).until(
            EC.element_to_be_clickable((By.XPATH, '//*[@id="commands_lineups-2-man"]/div[4]/button[2]'))
            );
    selector3.click()

    selector4 = WebDriverWait(driver, 20).until(
            EC.element_to_be_clickable((By.XPATH, '//*[@id="share"]/p/input'))
            );
    selector4.click()

    selector5 = WebDriverWait(driver, 20).until(
            EC.element_to_be_clickable((By.XPATH, '//*[@id="modal-content"]/p[1]/strong/a'))
            );
    selector5.click()
Scraping
This code finds the table, and creates a pandas dataframe. I save dataframes into a feather file incase I want to implement Machine Learning models in R.
def scrape_all_players(driver):
    for idc, xyz in enumerate(site_list()):
        main_url = xyz
        driver.get(main_url)
        player_list_alphabet = driver.find_elements_by_xpath('//th//a')

        def returnthis():
            href = []
            for item in player_list_alphabet:
                href.append(item.get_attribute('href').replace('.html', '/lineups/2016'))
            return href

        for z in returnthis():
            driver.get(z);

            url = driver.current_url
            response = requests.get(url)
            page = response.text
            soup = BeautifulSoup(page,"lxml")

            check_me = soup.findAll('tr')

            if check_me == []:
                continue
            else:
                selector_tools()
                url = driver.current_url
                response = requests.get(url)
                page = response.text
                soup = BeautifulSoup(page,"lxml")

                table_headers = [th.getText() for th in soup.findAll('tr', limit=2)[1].findAll('th')]
                data_rows = soup.findAll('tr')[2:]

                player_data = [[td.getText() for td in data_rows[i].findAll('td')] for i in range(len(data_rows))]
                player_data_02 = []

                for i in range(len(data_rows)):
                     player_row = []

                for td in data_rows[i].findAll('td'):
                    player_row.append(td.getText())

                player_data_02.append(player_row)
                df = pd.DataFrame(player_data, columns=table_headers[1:])
                df = df[:-1]

                playername = soup.find('h1').getText()
                playername = playername.split(' 2')[0]
                df['playername'] = playername

                if os.path.isfile('my_2016nbafile' + str(idc) + '.feather') == False:
                    path = 'my_2016nbafile' + str(idc) + '.feather'
                    feather.write_dataframe(df, path)
                else:
                    ogdf = feather.read_dataframe('my_2016nbafile' + str(idc) + '.feather')
                    df = ogdf.append(df, ignore_index=True)
                    path = 'my_2016nbafile' + str(idc) + '.feather'
                    feather.write_dataframe(df, path)


scrape_all_players(driver)
After scraping thousands of rows, and merging different sources, it was now time to manipulate my data into something that I could use machine learning on.
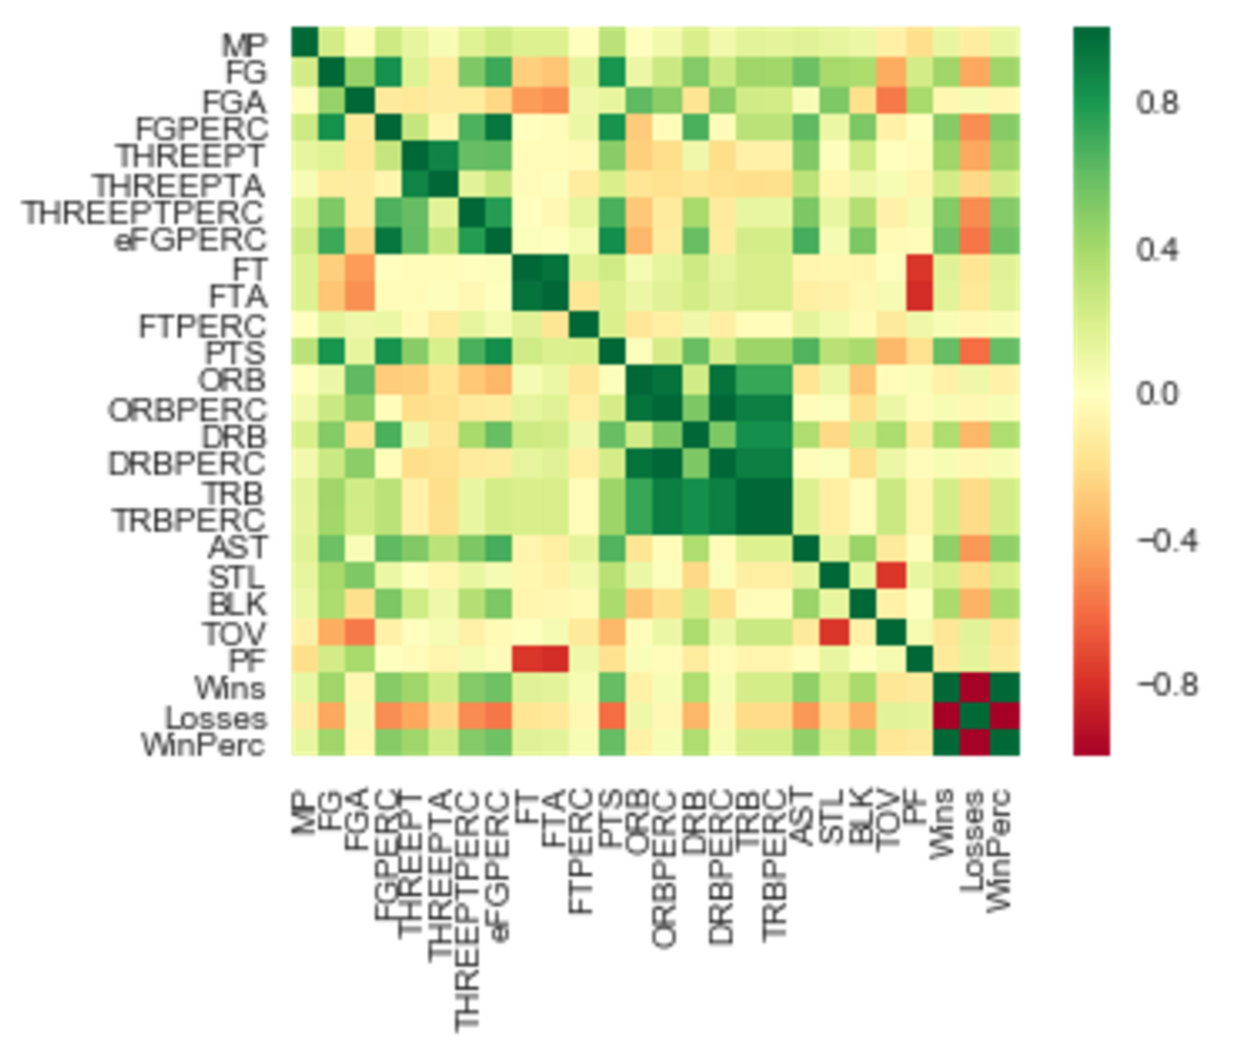
My first step was to look at multicollinearity because I knew many of the variables would be correlated. I made a heatmap using seaborn to show this.
I tried 3 types(linearcv, lassocv and ridgecv) of regression formulas using sklearn. Ridge seemed to work the best because it set a penalty on large coefficients.
My R-Squared was significantly better and I plotted using Plotly(interactive chart) actual Win Percentage vs Predicted
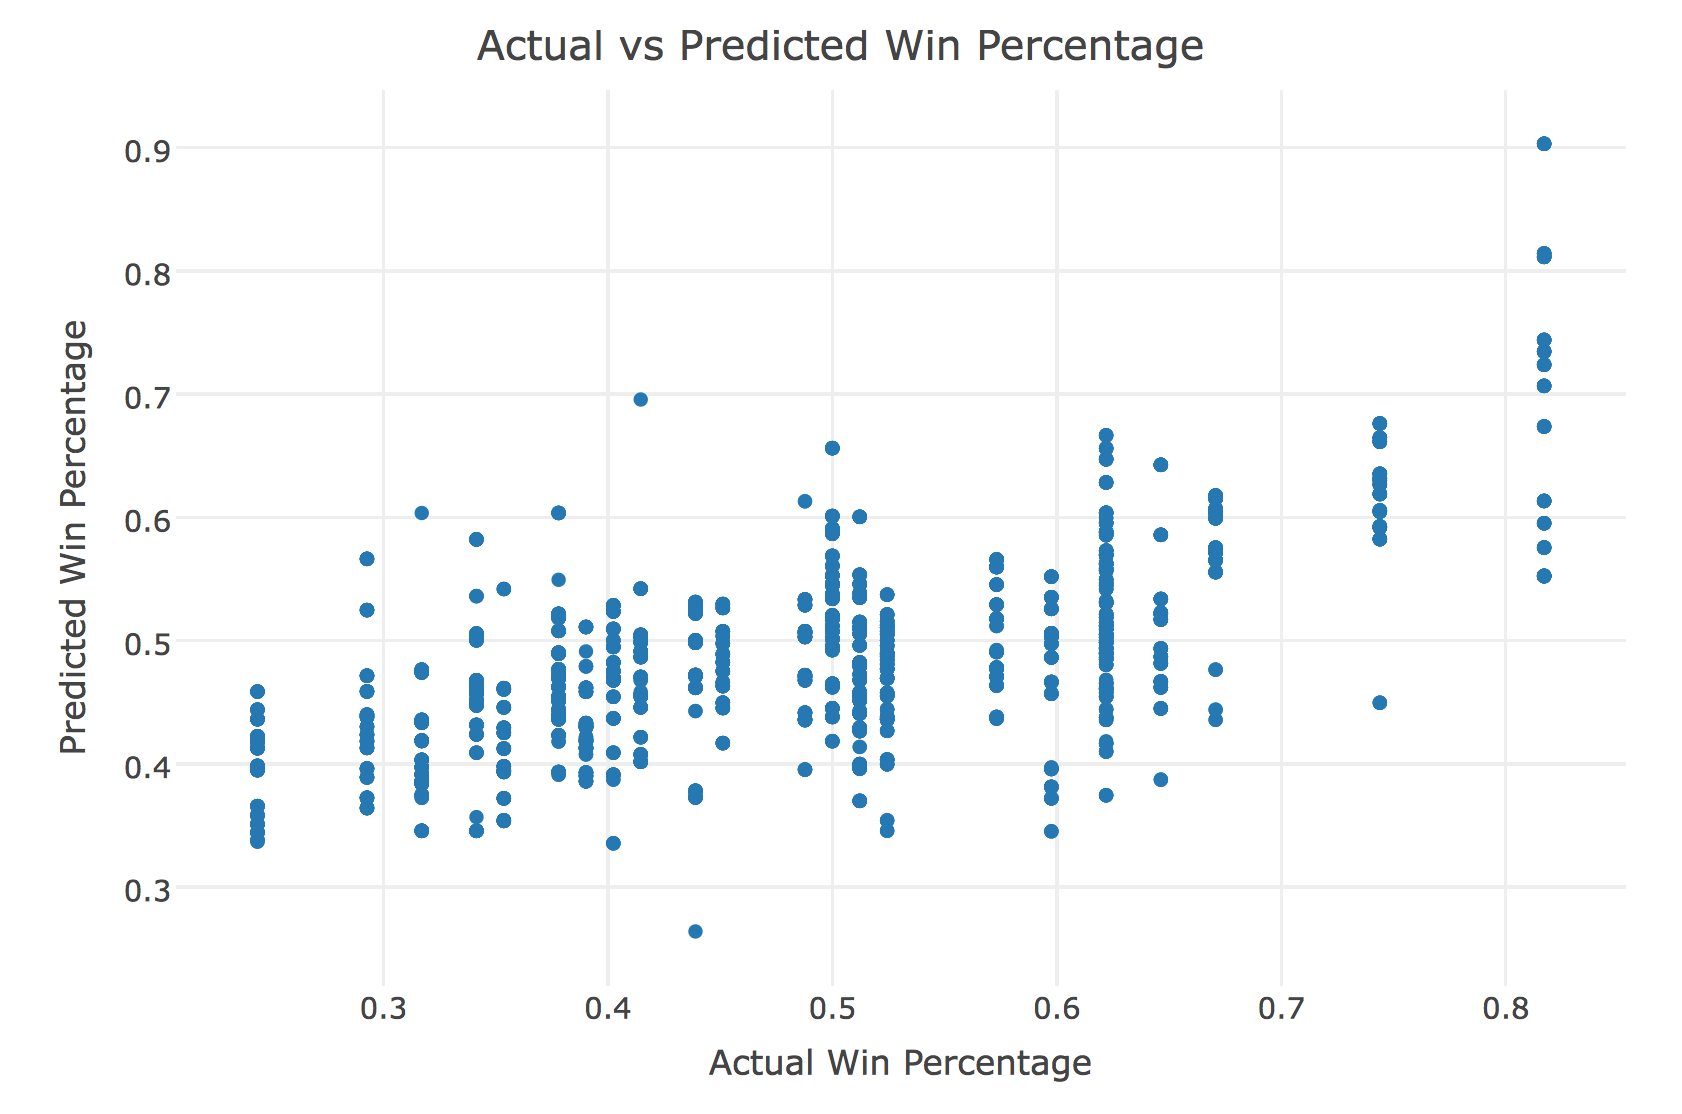
All the outliers in the right were the Golden State Warriors, which I expected because they have been amazing. One interesting point I did find was that the uppermost right point was Javale McGee. This surprised me because his stats don’t pop out. His stats are nothing special. However, According to the data he is a phenomenal teammate. Attributes that Javale Mcgee are good at are not represented in traditional NBA stats. NBA stats don’t account for hustle, quick on defense, etc.
Overall, I thought my project did a great job of showing how team chemistry can predict wins and the plots I made, showed how team chemistry contributes to those wins.
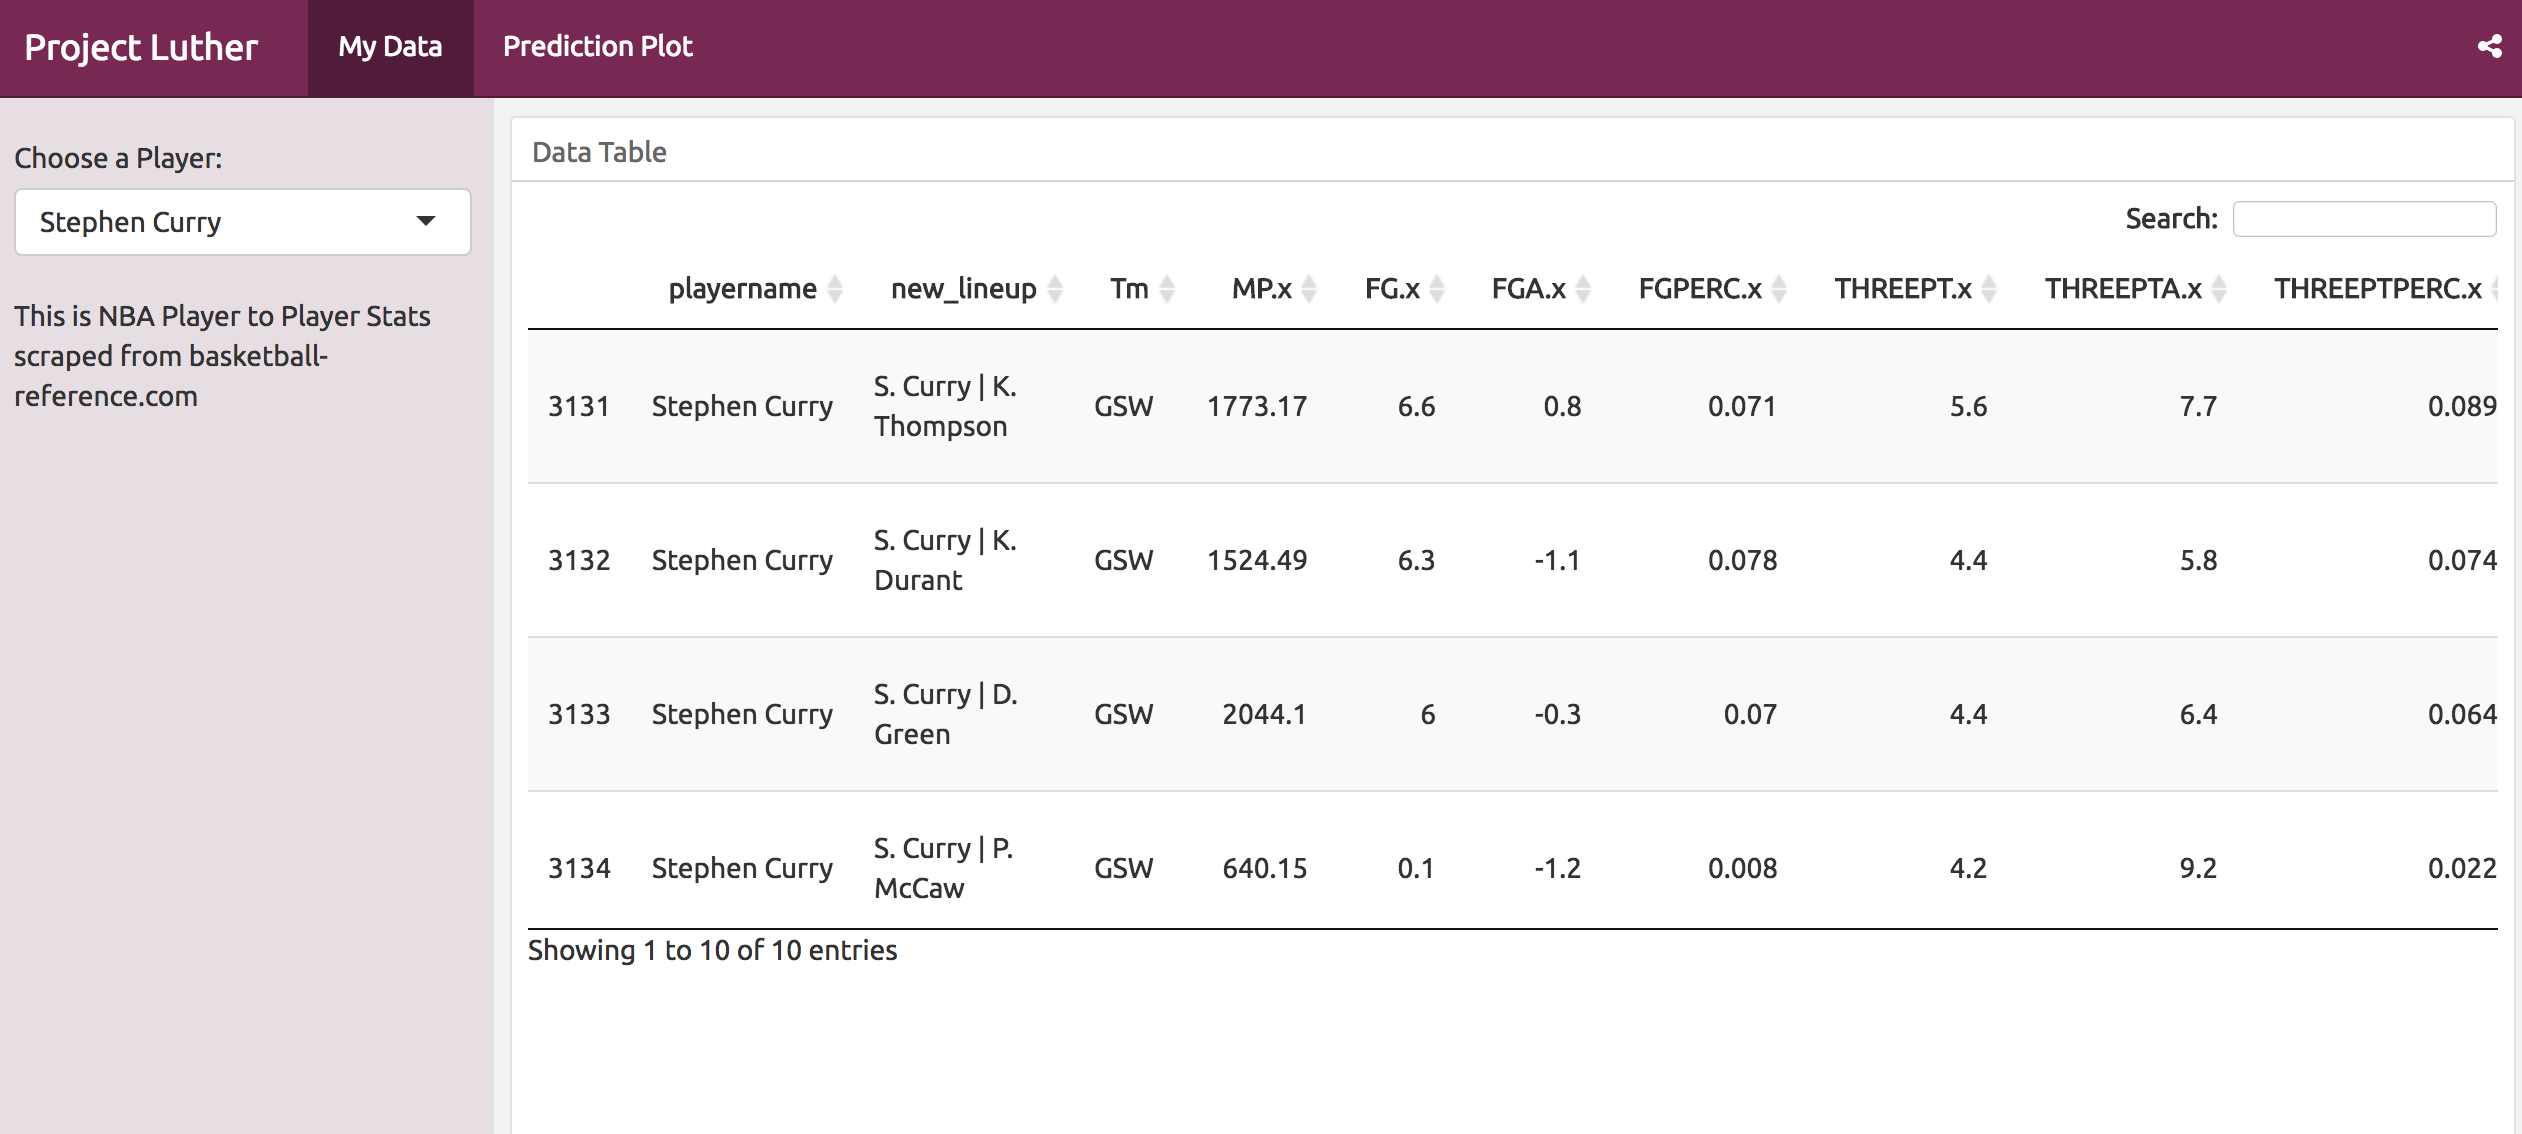
Also, if anyone would like to see the data and one of the plots, I made a quick dashboard using Shiny, DT,Plotly and R. Go check it out at Project Luther Dashboard!